Interactive chart
Marine Heat Waves by Basin — 1982 to Present
The time series aggregates MHW metrics (affected area fraction, mean intensity, cumulative intensity) for each Mediterranean sub-basin. The embedded interactive chart lets you filter by basin, zoom, pan, and download the data.
Select a basin
Click a basin name in the legend to toggle it on or off. Double-click to select it and deselect the rest.
Zoom in
Click and drag on the chart to zoom into a time period.
Pan
Hold Shift and drag to pan across the time axis.
Download
Use the plot menu (top right of chart) to save as PNG.
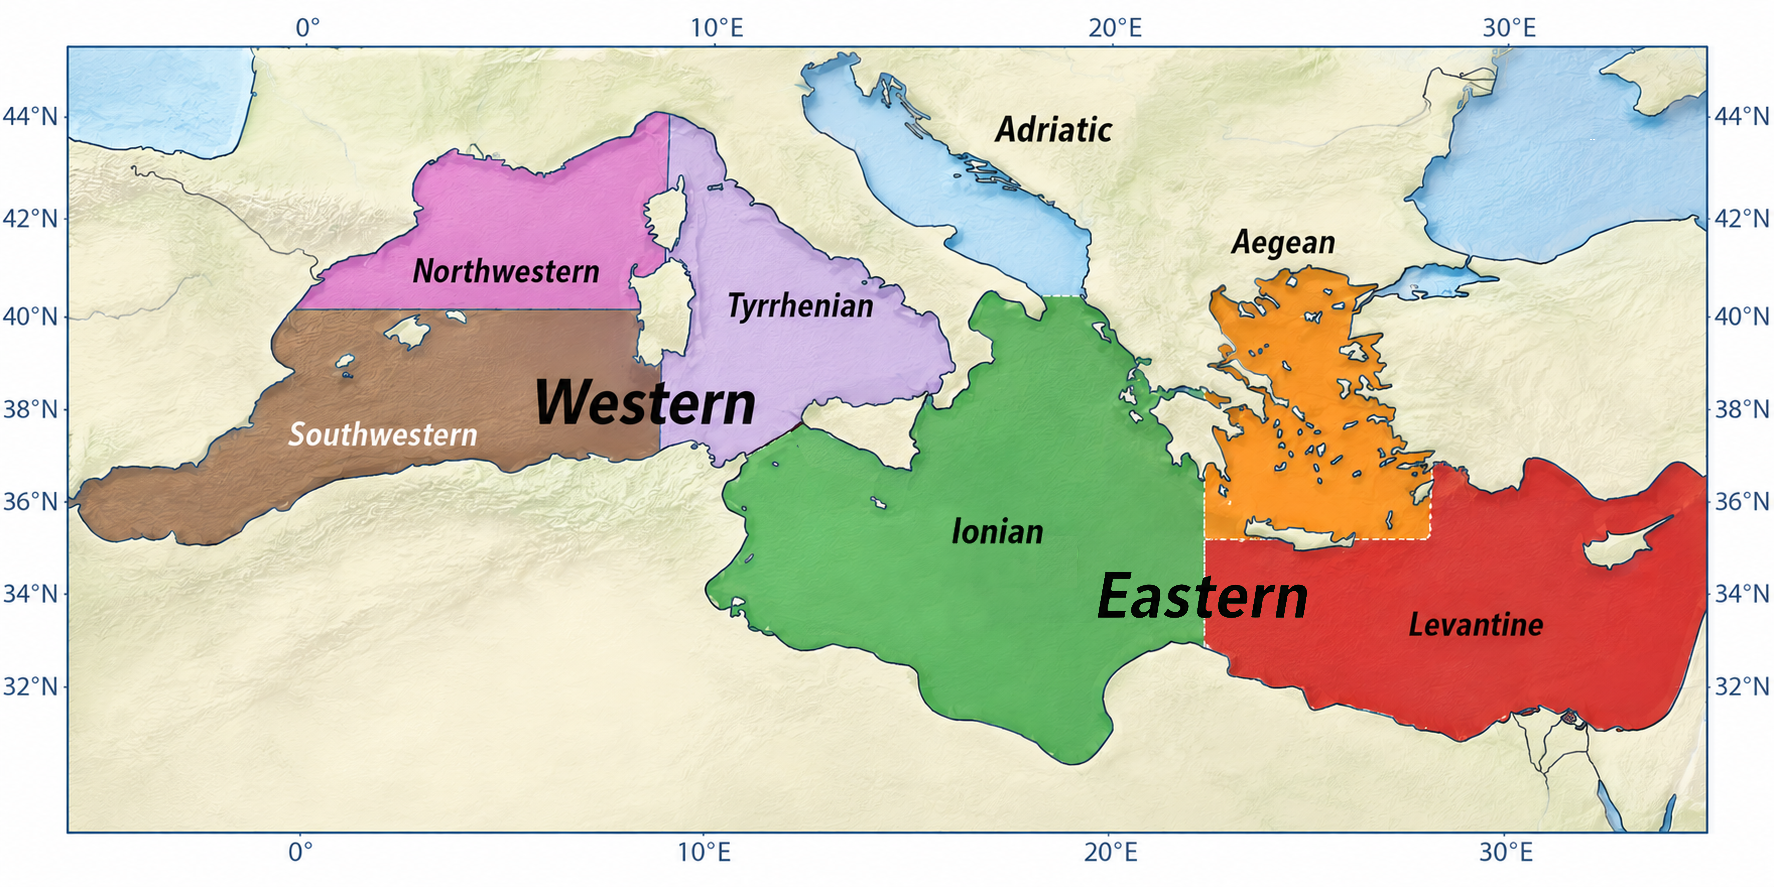
Mediterranean sub-basin MHW time series
Use the basin map above as reference
Select the desired basin from the legend, zoom, pan, and explore MHW data since 1982.